
Developer tools
Developer tools
In short
Fixing a page by hand usually means a browser’s DevTools in one window, the template in an editor in another, and a reload to see whether it worked. Wanigan keeps the page’s own DevTools, a real code editor and what the page reports in a dock beneath your local site, and the page follows every save, yours or an agent’s.
On this page
Why it is here
Every switch between programs loses your place: which element you were looking at, which file made it, which line. The dock beneath the live page holds the tools for working on that page, next to it.
- DevTools: Chromium’s own DevTools for the page, the same panels as in Chrome.
- Code: a real code editor, with the file that made the part you chose.
- Problems and Request: what the page reports as wrong, and the request behind it.
You, or an agent
A fix can take either of two routes, and the page follows both.
- You change it. Open the part’s file in the code editor beside the page (Code, .), change it, and save with On a Mac, ⌘S; on Windows and Linux, Ctrl+S.
- An agent changes it. Hand the part, a snap or what the page reports to a coding agent as a note (Build with an agent), and it edits the files in its own session.
Either way, the page reloads (or swaps only its stylesheets) and outlines the parts the changed file made. Your save is in the project’s Activity as yours; an agent’s change is in its session, for you to review in Changes. The editor never saves over an agent’s change, and says who changed a file while you had it open.
The dock
The dock sits beneath the page, closed until you open it. Its tabs:
| Tab | What it holds |
|---|---|
| Code | The code editor. Its count is how many files you have open, with a dot when one is unsaved. |
| Notes | Notes for an agent, waiting to be sent together (Build with an agent). |
| Problems | What the page reports: its errors, warnings and console. The count turns red when one is an error. |
| Request | The hooks, queries, assets and logs behind the page, from the site helper. Only for a Drupal or WordPress site. |
| DevTools | The page’s own DevTools: elements, console, network, sources, application, performance. |
- The tabs wait at the end of the status line. A tab opens the dock on itself; pressing the tab already shown closes it.
- On a Mac, ⇧[; on Windows and Linux, Shift+[ and On a Mac, ⇧]; on Windows and Linux, Shift+] open the dock on the tab it last showed, then step through the tabs, from the window or from the page.
- On a Mac, ⌘J; on Windows and Linux, Ctrl+J stays the code editor’s: from another tab it shows Code, and from Code it hides the dock.
- Drag its edge to resize it, or focus the edge and use the arrow keys, Home and End. A button puts it beside the page instead of beneath, and back.
- What it shows, its height (or its width beside the page), its side and whether it is open are kept on this computer.
Picture: to come
A screenshot of the real app, with the demo’s data, of what the title above says.
The page’s DevTools
DevTools is the browser’s own set of panels for looking inside a page: its HTML and styles, its console, its network requests. In the dock it is Chromium’s DevTools for the page you see, beneath it or beside it, following the dock as you resize or move it.
Open DevTools
Click DevTools among the dock’s tabs, or press On a Mac, ⌥⌘I; on Windows and Linux, Ctrl+Shift+I, Chrome’s own key, which works from the window, from the page and from DevTools itself. View › Page DevTools does the same, and so does “Page DevTools” in search and commands (On a Mac, ⌘K; on Windows and Linux, Ctrl+K) once you type it.
A Northstar product page with the dock open beneath it on DevTools: Chromium’s Elements panel showing the page’s HTML, and under it the line saying Wanigan’s marks are in this page’s HTML, with Open in its own window.. Current beta · demo 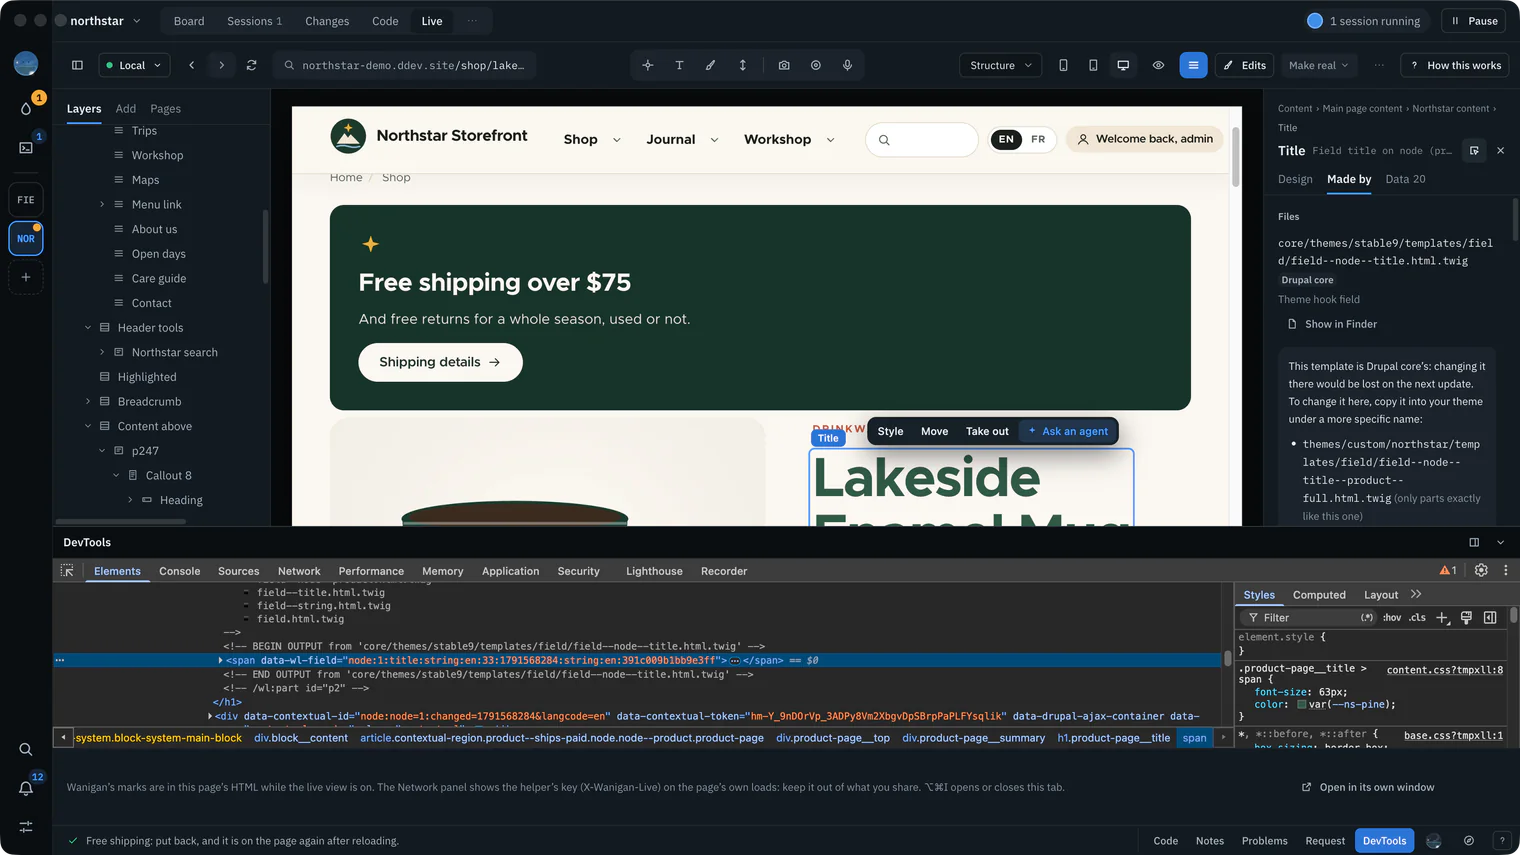
Choose a part
Select a part on the page (P), or choose it in Layers.
Show it in DevTools
Press Show in DevTools beside the part’s name in the Inspector, or the same button at the end of its row in Layers, or On a Mac, ⇧D; on Windows and Linux, Shift+D. The dock opens on DevTools if it was closed, the page scrolls to the part if none of it is on screen, and Elements selects its element.
Show in DevTools on the Northstar product title: the title outlined in blue on the page, and in the dock’s DevTools the Elements panel with its element selected.. Current beta · demo 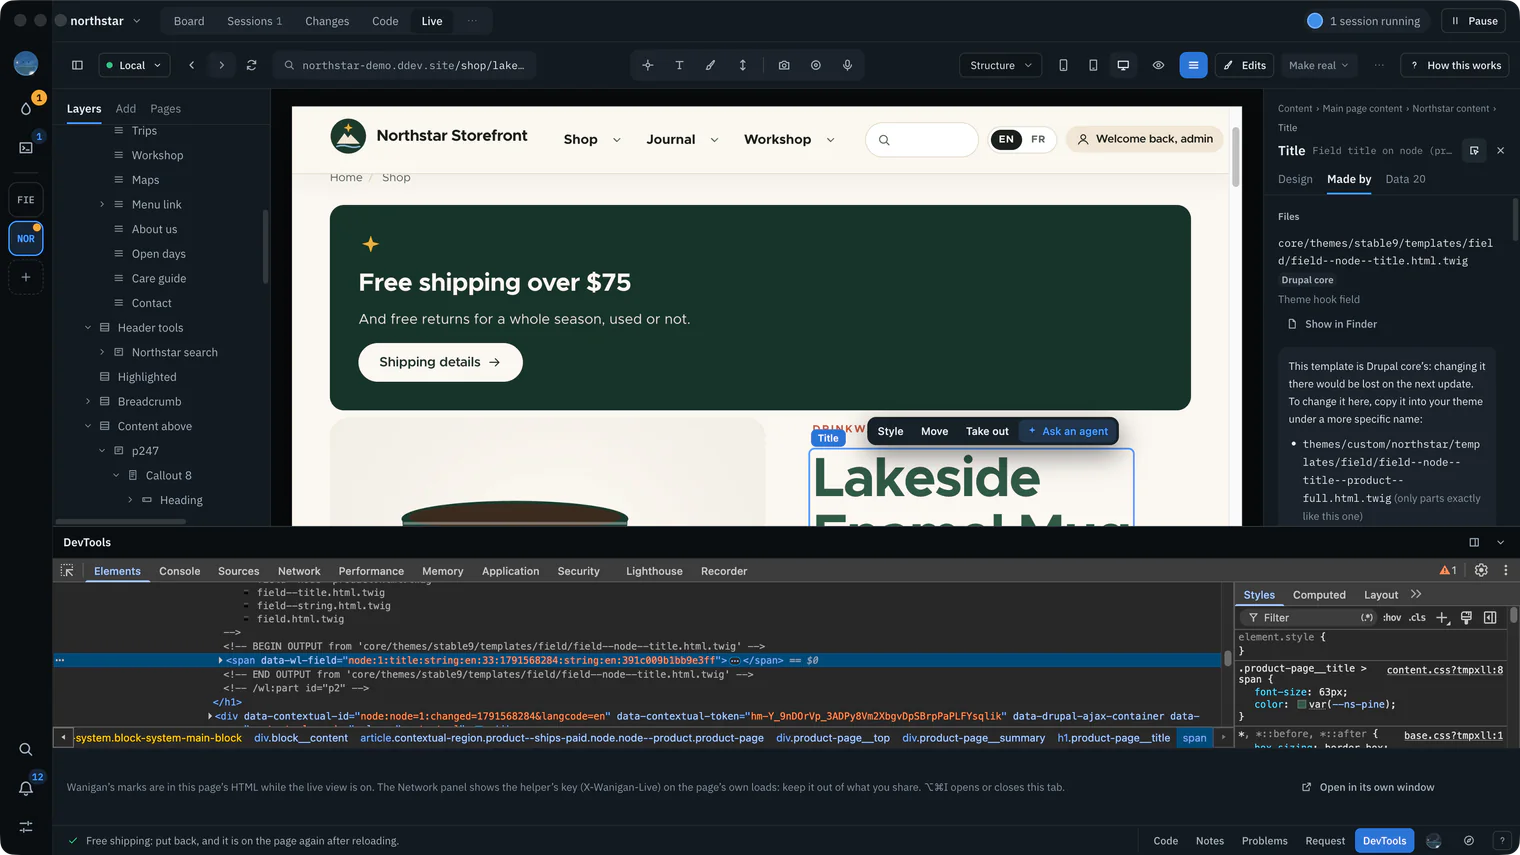
Work as in Chrome
Every panel is DevTools’ own: Elements with its own picker, Console, Network, Sources, Application and Performance.


- Open in its own window puts DevTools on a second screen. The tab then says “DevTools is in its own window.”, with Back into the dock and Close DevTools.
- Hiding the tab (another tab, or the dock closed) keeps DevTools as it was, its console and its selection with it. Going to another page keeps it too. Leaving the project closes it.
What of the page is Wanigan’s
While the live view is on, the page’s HTML holds a few things that are Wanigan’s, not your site’s. The line under DevTools says so.
- Wanigan’s page script, and the outlines it draws.
- With the site helper, its
wl:comments around each traced part (<!-- wl:part id="…" -->) and itsdata-wl-*attributes: on Drupaldata-wl-entity,data-wl-field,data-wl-view,data-wl-blockanddata-wl-paragraph; on WordPressdata-wl-block. - In the Network panel, the helper’s key, the
X-Wanigan-Liveheader, on the page’s own loads. The line under DevTools says to keep it out of what you share.
The helper acts only for requests that carry the key, which only the live view sends, so the site looks the same in any other browser. The site helper explains the key.
These are the page’s own DevTools, with none of Wanigan’s privileges. Wanigan’s own window has separate ones, View › Wanigan’s Developer Tools, which moved to On a Mac, ⌥⇧⌘I; on Windows and Linux, Ctrl+Alt+Shift+I because Chrome’s key now belongs to the page.
The code editor
A real editor, CodeMirror 6, for changing files by hand without leaving Wanigan. It loads the first time you open a file and stays loaded while the window is open, so every open file keeps its own undo history, cursor and scroll.
- In the live view it is the dock’s Code tab, beneath or beside the page.
- In any other view of a project it is a drawer beneath the view, or beside it; On a Mac, ⌘J; on Windows and Linux, Ctrl+J shows or hides it.
- The project’s Code tab (G then E) shows the same editor as the whole view, beside the project’s files. It is the drawer’s own editor, not a second one: the drawer steps aside while the tab shows and comes back as you left it. On a Mac, ⌘J; on Windows and Linux, Ctrl+J on the tab goes back to the view you came from.
Picture: to come
A screenshot of the real app, with the demo’s data, of what the title above says.
Opening a file
| From | How | It opens |
|---|---|---|
| Anywhere in a project | On a Mac, ⌘P; on Windows and Linux, Ctrl+P, then a few letters of the name or path; name:42 for a line | That file, at that line |
| Changes, or a turn’s changes | Edit on a file | That file, in the checkout shown, or the folder the session worked in |
| A chosen part in the live view | Code (.) in the Inspector | Its component’s Twig file, or the template that made it, at the words you picked |
| Made by, or the component library | A file’s name | That file |
| The Code tab | The files beside the editor: arrows walk, Enter opens, Space opens and keeps the keys in the tree, typing a name jumps to it | That file |
Quick open lists the files git sees: tracked ones, and untracked ones it does not ignore. Include vendor and node_modules adds installed code. With nothing typed, it lists the files open now and the places you visited lately.
Change a template and save
Choose the part
On a Northstar page that lists products, select one product card: P, then click it.
Open its file
Press Code in the Inspector’s Design tab, or .. The dock opens on Code with the part’s file: its component’s Twig file (here
product-card.twig), or the template that made it. When the file writes the words you picked, the cursor lands on them; words that come from content are not in a template.Code on the Northstar product title: the title outlined on the page, and the dock open beneath it on Code with the core template that rendered it, its breadcrumbs, and the line saying changes there are lost when Drupal updates.. Current beta · demo 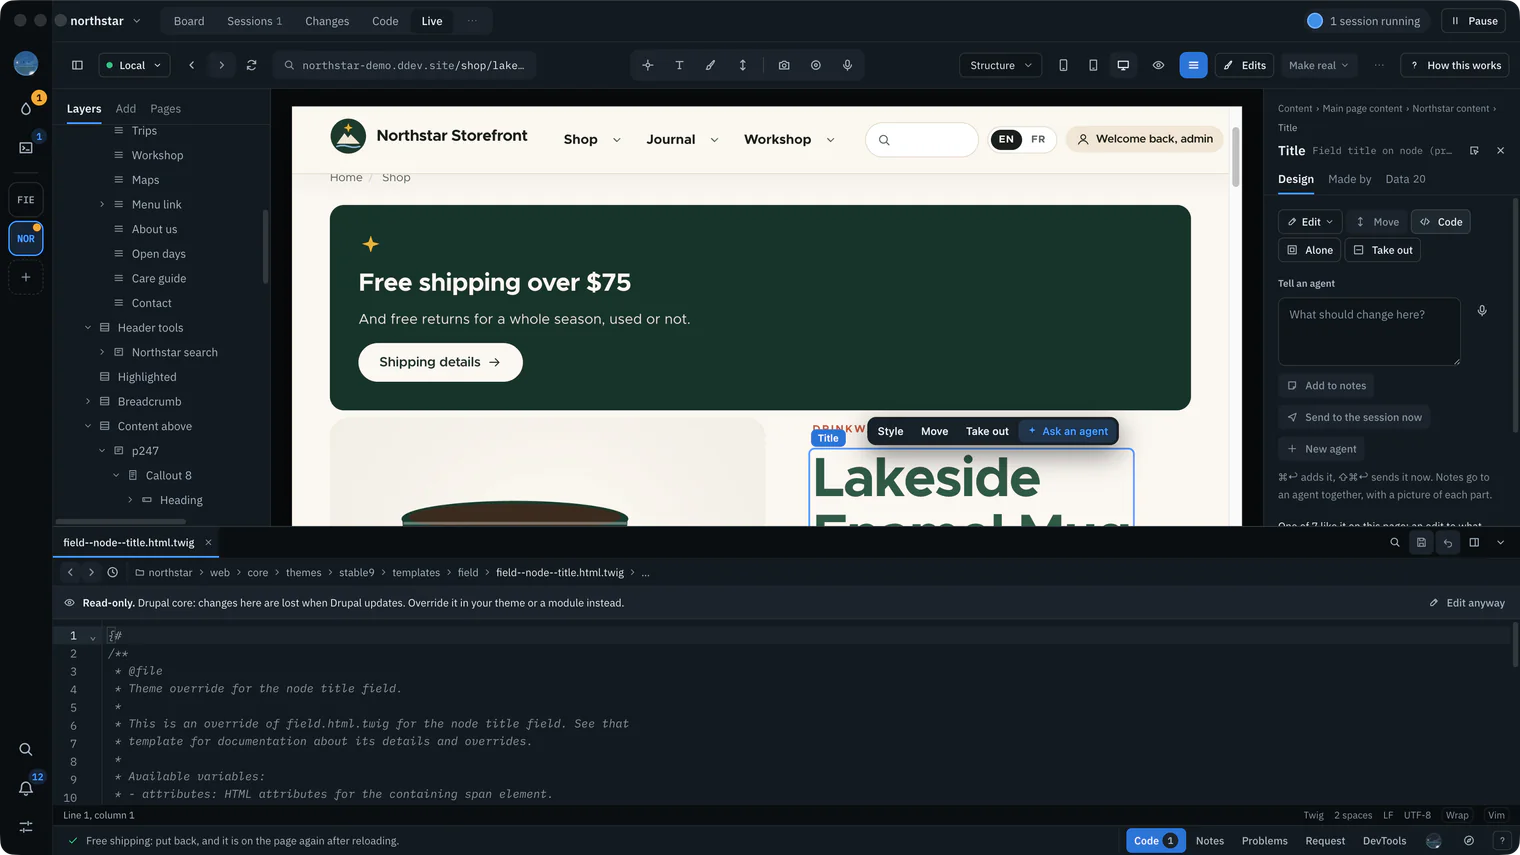
Change it, and save
Edit as in any code editor; a dot on the file’s tab marks it unsaved. On a Mac, ⌘S; on Windows and Linux, Ctrl+S saves.
Watch the page follow
The page reloads, or swaps only its stylesheets for a CSS file, and outlines the parts the file made. The status line names the file and how many parts it outlined, and the save is in the project’s Activity as “You edited …”.
Just after saving the theme’s content.css with a rule for the product title changed: the page reloaded with the title it styles outlined, and the status line saying content.css changed and outlining the part of the page its changed rules style.. Current beta · demo 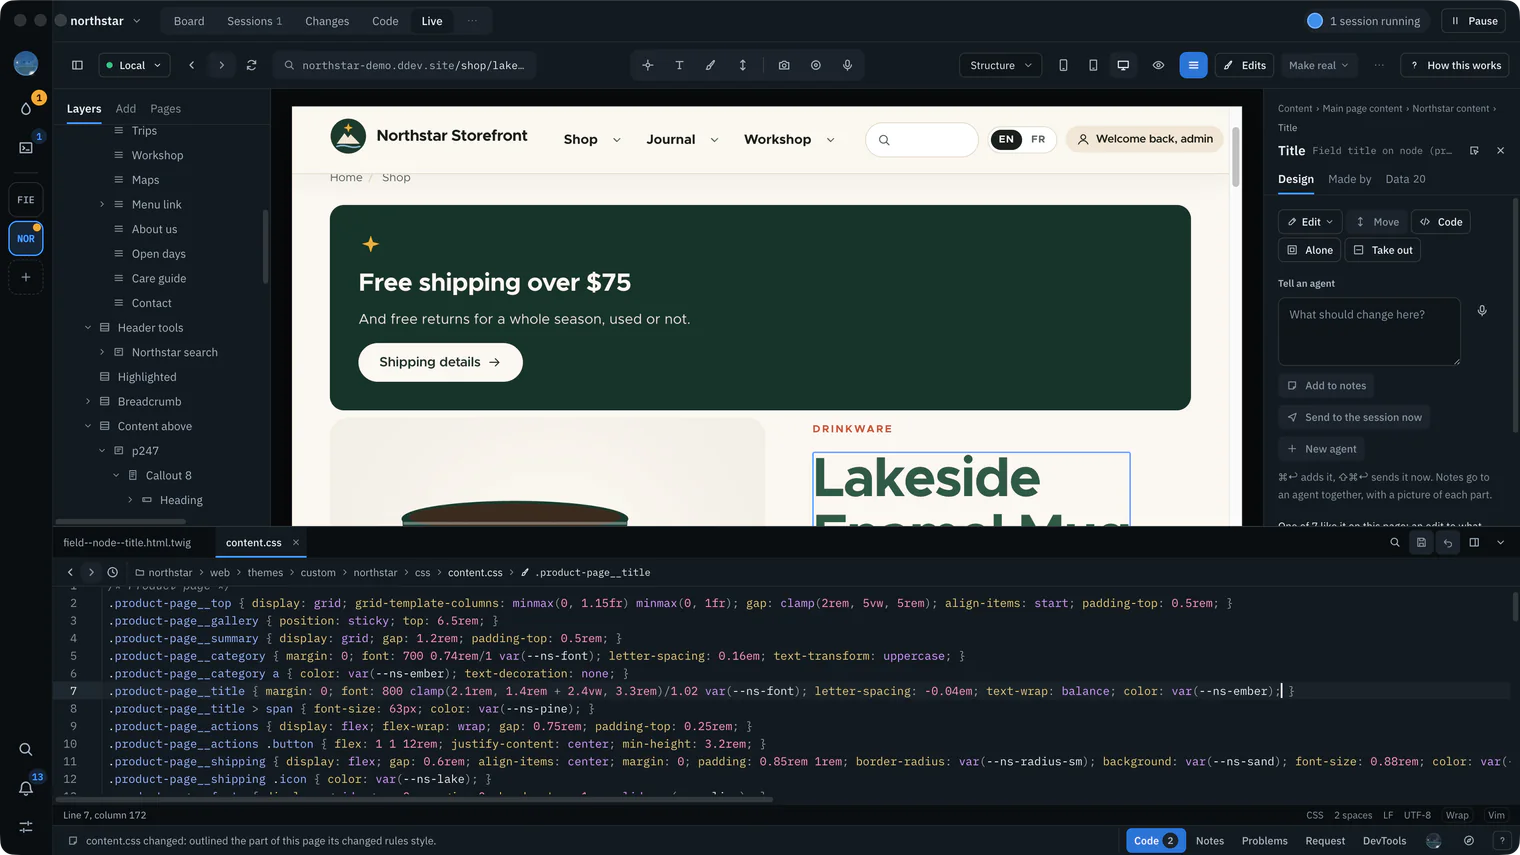


Code is greyed out, saying why, when the page does not say which file made the part, when its template is outside the project’s folder, or when the site’s folder is not known.
An editor, not a text box
- Highlighting for PHP, Twig (with the HTML, CSS and JavaScript around it), HTML, CSS, Sass and SCSS, JavaScript and TypeScript, JSON, YAML, Markdown, XML, shell scripts, TOML,
.envand other settings files, Dockerfiles and nginx configuration. - Line numbers, folding, bracket matching and closing, several cursors and rectangular selection. On a Mac, ⌘D; on Windows and Linux, Ctrl+D adds the next match of what is selected.
- Search and replace (On a Mac, ⌘F; on Windows and Linux, Ctrl+F) and go to a line (On a Mac, ⌃G; on Windows and Linux, Ctrl+Alt+G).
- Completion from the language (CSS properties, HTML tags and attributes, JavaScript) and from words already in the file.
- New lines indent the way the file already does. Line endings and a byte order mark are kept as the file has them.
- Soft wrap (On a Mac, ⌥Z; on Windows and Linux, Alt+Z) and Vim keys, each a switch in the line under the text, which also gives the line and column, the language, the indentation, the line endings and the encoding.
- Revert puts the saved file back, and can itself be undone.
- Esc then Tab leaves the editor for the rest of the window.
Breadcrumbs, Back and Forward
Breadcrumbs are the trail above the text: the file’s folders, the file, and where the cursor is inside it, such as a PHP class and method, a Twig block and the HTML in it, a CSS rule, a YAML key or a Markdown heading.
- Each crumb opens a menu of what is beside it: a folder’s other files, a method’s sibling methods, a rule’s sibling rules. Typing narrows the menu.
- On a Mac, ⌘⇧.; on Windows and Linux, Ctrl+Shift+. moves to the breadcrumbs; ← and → walk them; Enter or ↓ opens one; Esc goes back to the text.
- Back and Forward go between every place you jumped to, across files: On a Mac, ⌃-; on Windows and Linux, Alt+← and On a Mac, ⌃⇧-; on Windows and Linux, Alt+→, the two buttons, or the mouse’s own back and forward buttons. Hold either button, or right-click it, for the recent places.
- A jump is opening a file, going to a line, a breadcrumb, Code from the live view, switching tabs, or moving the cursor ten lines or more at once.
Never over an agent’s work
Agents edit the same files you do. A save names the version of the file it was made from, and if anything changed the file since, nothing is written.
- With nothing unsaved, a file an agent changes reloads, keeping your cursor where the text did not change, and says who changed it, such as “Claude Code (its session’s title) changed this file.”, with Compare.
- With your changes open, nothing is replaced. The notice says your changes are not saved yet, and offers Compare and merge, Reload theirs or Save mine over it.
- A save refused because the file changed first opens the merge at once.
- An agent’s edit is noticed at once, and any other program’s within a few seconds. The name given is the agent session whose own hooks last reported writing the file, or “Another program”.
- A file deleted, moved or renamed while open says so; its text stays to copy, but saving cannot bring it back.
Picture: to come
A screenshot of the real app, with the demo’s data, of what the title above says.
The merge shows the file as it is now on the left and your text on the right. The right side is what gets saved: the arrows take a change across from the left, and you can type in it freely. Save merged writes it, Use theirs takes the file as it is, and Back to my text closes the merge.
Someone else’s code
Code you did not write is replaced the next time it updates, and a change made there is lost. So it opens read-only: you can read, search and copy it, but not type in it. The notice above the text says why, and what to do instead.
| A file in | What the notice says |
|---|---|
| Drupal core | “Drupal core: changes here are lost when Drupal updates. Override it in your theme or a module instead.” |
| A contributed module, theme or profile | “A contributed project: changes here are lost when it updates. Override it in your theme, or patch it through Composer.” |
| Composer’s vendor folder | “Composer’s vendor folder: changes here are lost on the next composer install.” |
| node_modules | “Installed by npm: changes here are lost on the next npm install.” |
| WordPress core | “WordPress core: changes here are lost when WordPress updates. Use a child theme or a plugin instead.” |
| A WordPress plugin | “A WordPress plugin: if it came from WordPress.org or a vendor, its next update replaces these changes.” |
Edit anyway unlocks it if you mean it. The notice then says “Editing someone else’s code: a change here is lost when it updates.”, and Activity records the save as someone else’s code, edited anyway. A file the disk itself will not let you write stays read-only: Wanigan will not change its permissions.
To change a core or contributed template the lasting way, copy it into your theme with Create override… in the Inspector’s Edit menu (Picking and the Inspector).
What never opens
- Anything outside the project folder, or a card’s own worktree, including through a link.
- Git’s own records.
- A binary file, UTF-16, or text in any encoding but UTF-8.
- A file over 2 MB.
Unsaved text
Unsaved text survives closing the window. It is kept on this computer until you save it or throw it away, and comes back when the file opens again: “Your unsaved changes from … are back.” If the file changed meanwhile, it says so and offers Compare and merge or Throw them away.
Closing an unsaved file’s tab asks first: Save and close, Close without saving, or Cancel.
Problems
Some faults never show where you are looking: a script error in the console, a warning the site printed at the top of a long page. Problems gathers what the page reports as wrong.
Open Problems
Click Problems among the dock’s tabs. Its count is how many the page reports, red when one is an error. With none, it says “Nothing wrong on this page.”
The dock’s Problems tab beneath the Northstar front page: “Nothing wrong on this page.”, the line saying there are no error or warning messages from the site and nothing logged as an error in its console since it loaded, and Check again.. Picture to come Picture: to come
A screenshot of the real app, with the demo’s data, of what the title above says.
Read them
Each row says Error or Warning, and where it came from. On the page is a message the site itself printed: Drupal’s error and warning messages, a WordPress error or warning notice, or an Xdebug error. Console is an error or warning the page logged since it loaded, with its file and line.
Hand them on, or check again
Add to notes puts every problem listed into one note that begins “Fix what this page reports:”, waiting in Notes to send to an agent (the message it gets). Check again reads the page again after you fix something yourself.
An agent’s own look at a page (live_problems) also lists requests that failed, from a fresh load in a hidden window. Your view records none.
The Request tab
With the site helper, Request shows the request behind the page shown: what it cost, and what ran to make it. Every number is what the helper measured in that one render, on this computer.
- Totals: time, queries and their time, memory and hooks, with the address, who it was rendered for and how many parts it has.
- Hooks, the points where a module, plugin or theme steps in to change what core does: in the order they fired, filtered by who implements them (Implemented by) or searched; the five slowest are marked, and the first 400 are listed.
- Queries, the database queries: slowest first, or grouped by the code that ran them. Pointing at one outlines the part it was for on the page, and Copy the SQL copies it.
- Assets: the scripts and stylesheets it added, with sizes where reported, and who added each.
- Logs: what was logged while the page rendered.
Picture: to come
A screenshot of the real app, with the demo’s data, of what the title above says.
Nothing in it sends anything. To hand a slow query to an agent, choose the part it outlines, write a note, and paste the SQL into it.
Keys
What has been tried
In depth
How DevTools sits in the dock
- Wanigan’s main process draws Chromium’s DevTools in a plain view of its own, handed to the page before DevTools opens, and lays it exactly over the tab. It follows the tab as the window, the dock’s edge, its side and the theme change.
- A native view draws above the window, so anything over the tab, such as a dialog or a menu, steps it aside, and its last picture stands in, as the page’s does.
- Electron loads DevTools into a view only once, so closing it in the dock destroys that view, and opening it again makes a new one.
- A new page view of the same project, such as another environment, gets DevTools again where it was. Any other page, leaving the project, closing the window or switching the live view off closes it.
- Show in DevTools opens the tab first, since the dock makes the page shorter, then asks the page to bring the part into view, at once when none of it is on screen, and points DevTools’ inspector at the centre of what of it is on screen. In its own window, DevTools stays there.
- When it cannot, it says why: “It is not on the page now: reload, or choose it again.”, “None of it is on screen, so DevTools has nothing to point at.”, or “DevTools could not open for this page.”
None of Wanigan’s privileges
- The page has no Node and no Wanigan preload.
- The view DevTools is drawn in is sandboxed, has no preload, uses an in-memory session of its own, never leaves
devtools://and opens no window. A link DevTools opens goes to your default browser. - The helper’s key is added only to the page’s own loads, the page and its frames on the site’s host, never to requests the page’s scripts make, so a script on the page cannot borrow it to call the helper.
- Every message the window sends the main process about DevTools is checked: who sent it, and what it holds.
More on what Wanigan guards, and what it does not, in Security and privacy.
How a save is written
- Paths are relative to the project folder or a card’s worktree.
.., an absolute path, an empty or.segment and anything named.gitare refused before the disk is touched, and a link must still lead inside the folder. - A save writes a temporary file beside the file, flushes it to disk and renames it over the file. Line endings, the byte order mark and the file’s permissions are kept; a file with mixed line endings is saved with the commoner one.
- Whose code a file is comes from markers on disk, not folder names: Drupal core by
core/lib/Drupal.php, WordPress core bywp-includes/version.php. A folder that is merely calledcoreis yours, andmu-pluginshold the site’s own code. - A save is recorded in Activity and sent to the live view as the same edit event an agent’s is, with no session; Changes reads the files again.
- Open files are checked for other programs’ changes every 2.5 seconds, and when the window comes forward.
- Unsaved text longer than a million characters is not kept between windows.
- A phone never receives the editor’s saves, and an agent session cannot read or write a file through the editor.
How quick open lists files
- In a git repository: what git tracks, plus untracked files it does not ignore, minus deleted ones. Elsewhere, a walk of the folder.
- Vendor and node_modules only when you tick Include vendor and node_modules.
- At most 40,000 files, and a walk stops after 3 seconds; either way the count says “not all of them”.
- From Changes showing a card’s worktree, it searches that worktree.
- The letters that matched are shown in bold.
- On a Mac, ⌘P; on Windows and Linux, Ctrl+P used to be Push; Push is now On a Mac, ⌘⌥P; on Windows and Linux, Ctrl+Alt+P.
How Twig is highlighted
A .twig file opens as CodeMirror’s own Jinja language laid over HTML. Twig shares Jinja’s print, tag and comment markers, its filters and its tests, so the HTML, CSS and JavaScript around them are highlighted too, and the few expressions only Twig has stay local instead of spoiling the rest of the file.
Each language loads only when a file of its kind first opens, and Vim keys only when switched on. The breadcrumbs read CodeMirror’s syntax tree, which is why they know a Twig block from a CSS rule.
Not built
- Creating, renaming or deleting files from the editor or the Code tab’s files.
- Searching the contents of every file: quick open finds files by name.
- Language servers: going to a definition, PHP diagnostics.
- Two files side by side, or one file in two places.